From region to expression in one run: the annotation-to-expression workflow
The composite annotation-to-expression workflow finds genes in a raw region and predicts expression for each one — walk through a worked example over the HBB locus.
The expression model on the DNA analysis platform reads a DNA sequence centered on a gene’s transcription start site (TSS) and returns a predicted expression level. That works when you already know where the TSS is. Often you start from a raw stretch of genome and don’t. The annotation-to-expression workflow covers that case: it runs gene finding to locate the TSSs in a region first, then predicts expression for each one, in a single run.
The workflow pairs two tasks, annotation (gene finding) and expression, so you can go from an arbitrary genomic window to per-gene expression without hand-centering anything.
What the workflow takes as input
The workflow reads the same two inputs as the expression task, but relaxes the requirement on the sequence:
- A DNA sequence — this no longer has to be TSS-centered. You can hand it a
raw region (a
chr:start-endrange pulled from Ensembl, pasted nucleotides, or an uploaded FASTA). On the platform, enable the Find genes first checkbox in the Expression task: it runs DNA annotation to locate each gene’s TSS in your sequence, centers a 9,198 bp window on it, and then predicts expression for that window. - An experimental context description — the same natural-language description of cell type, assay, and related metadata that conditions the expression estimate. Every gene found in the region is scored under this one context.
The result is one expression prediction per transcript the annotation step
locates, all reported as log(TPM+1).
A concrete example: a 16 kb window over HBB
To see the workflow end to end, I loaded a raw 16,000 bp region on chromosome 11
spanning the HBB (hemoglobin β) locus (chr11:5,219,000–5,235,000, GRCh38)
via the coordinate search, deliberately a plain region rather than a centered
gene window. I kept the platform’s built-in K562 experimental context (an
ENCODE-style polyA RNA-seq description of the K562 chronic myelogenous leukemia
line), enabled Find genes first, and clicked Run Analysis.
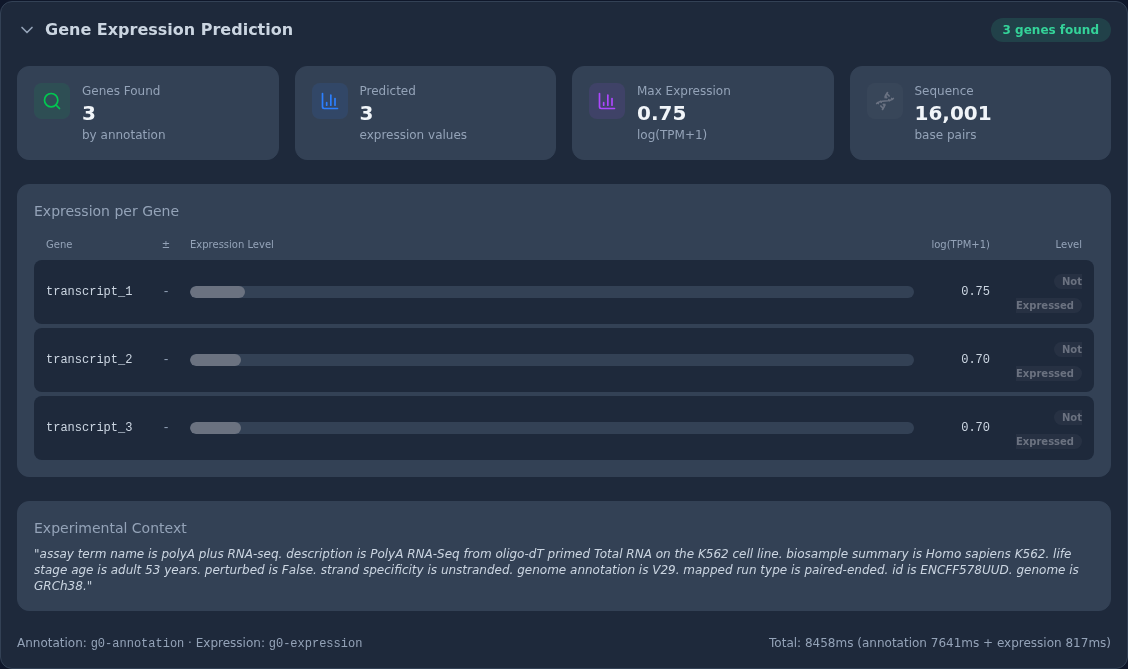
The Gene Expression Prediction panel reports the two steps together. The
headline cards read Genes Found 3 (by annotation), Predicted 3 expression
values, Max Expression 0.75 log(TPM+1), and Sequence 16,001 base pairs.
The annotation step located three transcripts in the region, and the
expression step returned a value for each. The Expression per Gene table
lists them: transcript_1, transcript_2, and transcript_3, all on the minus
strand, with predicted expression of 0.75, 0.70, and 0.70 log(TPM+1)
respectively, each labelled Not Expressed under the K562 context. The panel
echoes the K562 experimental-context description used for scoring, and the footer
records the two models, g0-annotation and g0-expression, plus the runtime:
8,458 ms total (annotation 7,641 ms + expression 817 ms).
Everything here started from a plain 16 kb region: the workflow found the genes, centered a window on each TSS, and scored them, with no manual step in between.
These are computational predictions intended for research and development, not clinical or diagnostic decisions. Try the annotation-to-expression workflow — on your own regions — at app.genomicintelligence.ai.