Enhancer activity prediction on the DNA Analysis Platform
The enhancer task is live on the Genomic Intelligence platform — score developmental and housekeeping enhancer activity along a sequence with DeepSTARR, walked through with the built-in Act5C example.
The enhancer task is now available as an interactive web application on the Genomic Intelligence DNA analysis platform at app.genomicintelligence.ai. Give it a stretch of DNA and it scores enhancer activity along the sequence — highlighting the regions most likely to act as regulatory enhancers.
Why enhancers matter
Enhancers are short stretches of DNA that turn genes up, often from a distance and in a context-specific way. Finding them and predicting how strongly they fire is central to understanding gene regulation, and it is a hard problem because the signal is distributed across the sequence rather than sitting at a single landmark. Reading enhancer activity straight from DNA is exactly the kind of sequence-to-function task a genomic model can take on.
What the model takes as input
The enhancer task takes a DNA sequence and returns activity scores along it.
On the platform you supply the sequence the usual ways: pick one of the built-in
gene examples, search for a gene or a chr:start-end range, paste raw
nucleotides, or upload a FASTA file. This task runs on the DeepSTARR model,
which is trained on Drosophila data and scores two enhancer programs
separately — developmental (Dev) and housekeeping (Hk) activity — so the
organism selector defaults to Drosophila.
Running the Act5C example
As a worked example we loaded the Drosophila Act5C (Actin 5C) reference — a 4,539 bp sequence — and ran the analysis.
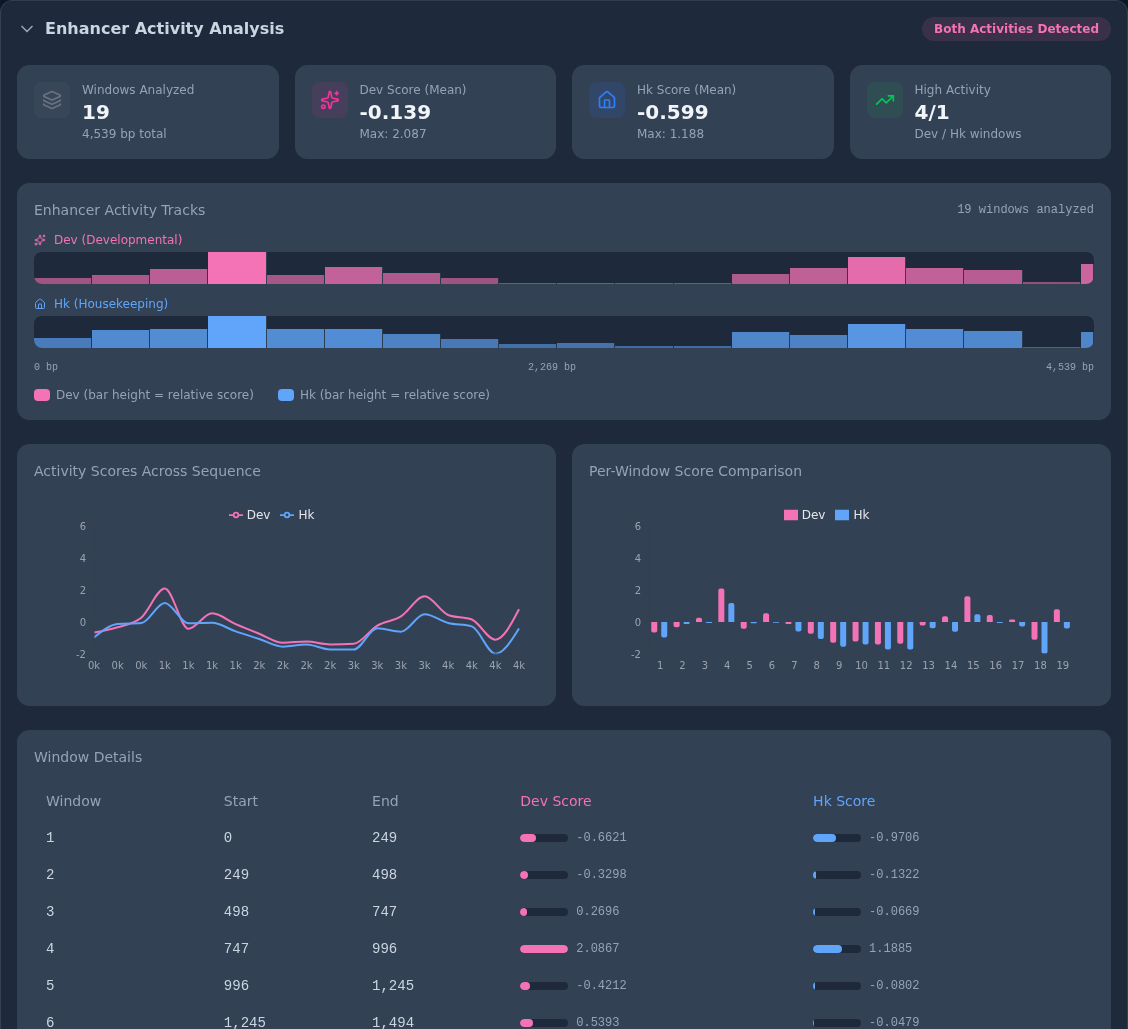
The dashboard splits the 4,539 bp sequence into 19 windows and scores each one for both programs, flagging that both activities were detected. The headline numbers are the mean and maximum score per program — a developmental mean of -0.139 (peaking at 2.087) and a housekeeping mean of -0.599 (peaking at 1.188). The two activity tracks plot those scores as bars along the sequence, the line and bar charts compare Dev against Hk window by window, and the Window Details table gives the exact coordinates and scores for each window. Window 4 (positions 747–996), for instance, stands out with the strongest signal in both programs (Dev 2.09, Hk 1.19), while most flanking windows score below zero. Each window is a concrete, coordinate-anchored readout you can line up against the sequence.
For research use
These are computational predictions intended for research and development, not clinical or diagnostic decisions. The DeepSTARR model is trained on Drosophila enhancer activity, so treat it as a tool for scanning and prioritizing candidate regulatory regions in that setting, not a substitute for experimental validation.