Introducing the Genomic Intelligence DNA Analysis Platform
The Genomic Intelligence DNA analysis platform is live, with Promoter analysis as the first task available as an interactive web application — walk through the built-in TP53 example.
Today we are launching the Genomic Intelligence DNA analysis platform at app.genomicintelligence.ai. It brings our sequence-to-function models — which read DNA sequence and predict biological activity — into a browser, so you can run a prediction, inspect the results, and build intuition without writing any code or standing up infrastructure.
The first task available as a web application is Promoter analysis: predicting promoter regions directly from DNA sequence. Paste a sequence, upload a FASTA file, or pull a gene straight from Ensembl, pick a promoter model, and the platform returns the predicted promoter regions laid out along your input in an interactive genome browser.
A concrete example: TP53
The app ships with predefined examples so you can see a real result on the first click. TP53 — the tumor suppressor with a well-characterized CpG-island promoter — is one of them.
Selecting the TP53 example loads the gene from Ensembl (GRCh38,
ENSG00000141510, transcript ENST00000269305.9, chr17:7,661,779–7,687,546,
minus strand) as a 25,768 bp sequence at 48.9% GC. Choosing the G0 Large
Promoter (2000bp) model and clicking Run Analysis returns the prediction in
a few seconds.
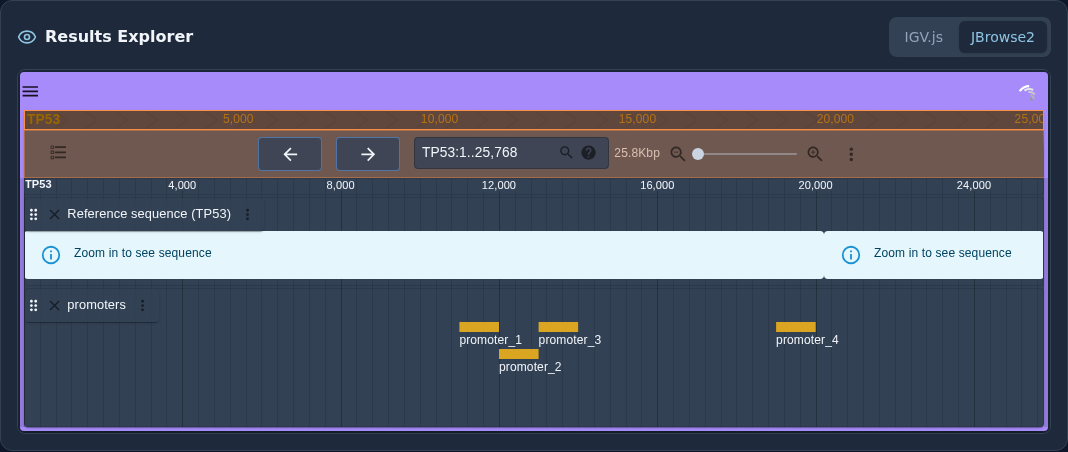
The Results Explorer shows the full 25.8 kb TP53 window with a reference sequence track and a promoters track beneath it. The model flags several discrete promoter regions along the locus, drawn as blocks at their predicted positions. You can pan and zoom the view, switch between JBrowse2 and IGV.js renderers, and zoom in far enough to read the underlying sequence.
Below the browser, the Promoter Detection Analysis window summarizes the same run as a dashboard — the per-window detail behind the blocks in the browser, so you can see how the model reached each call, not only where it landed.
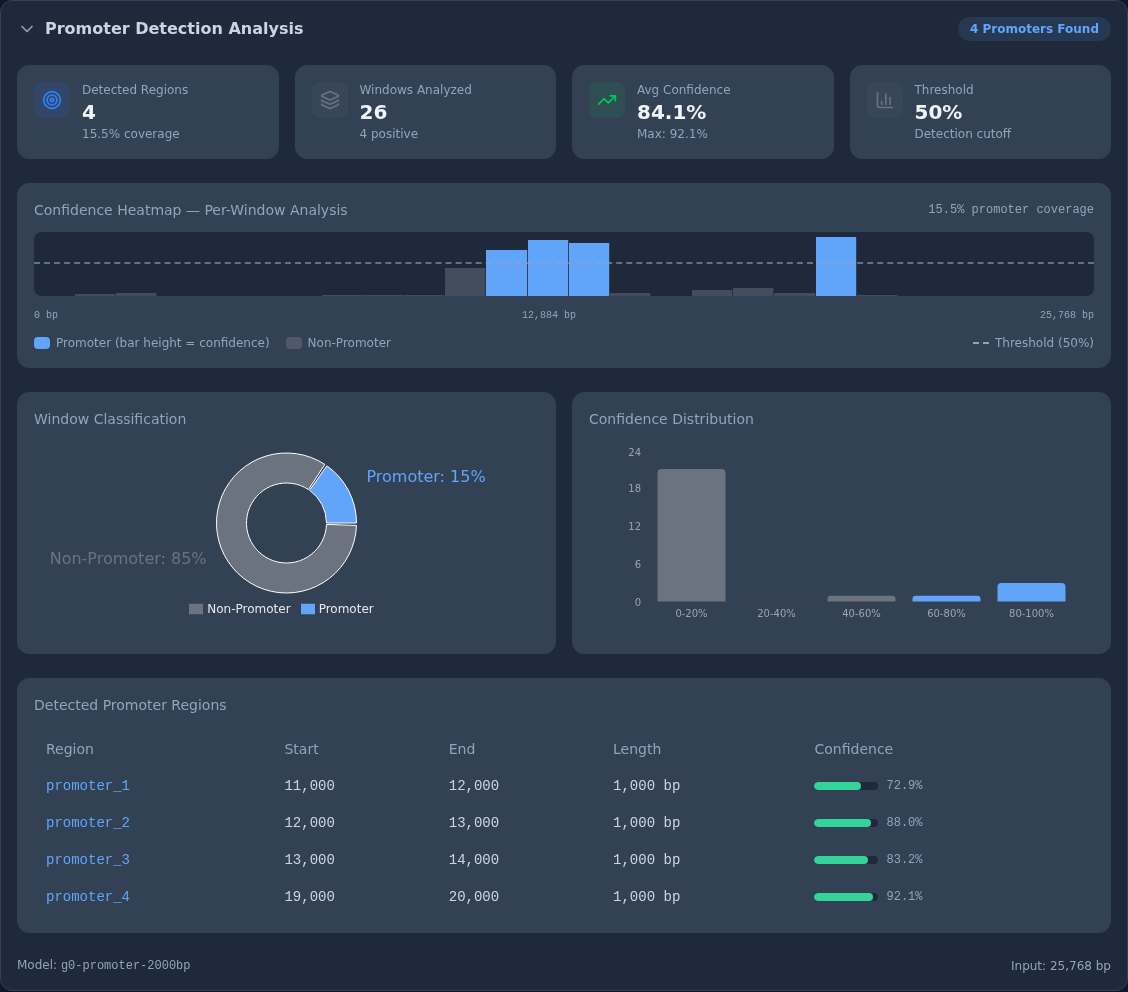
The window opens with headline metrics — how many promoter regions were detected, how many sequence windows the model scored, the average and maximum per-window confidence, and the detection threshold that separates a promoter call from background. Beneath them, the confidence heatmap lays every window out along the input (0–25,768 bp) with bar height encoding confidence and a dashed line marking the threshold, so you can see at a glance where along the locus the signal clusters. The Window Classification donut and Confidence Distribution histogram give the overall positive/negative split and how strong those calls were, and the Detected Promoter Regions table lists each predicted region with its start, end, length, and confidence — the same regions drawn as blocks up in the Results Explorer.
What’s next
Promoter analysis is the first task available as a web application, and more are coming. Our models already cover expression, enhancers, splice sites, gene finding, and more across multiple species, and we will be bringing those into the web app alongside the same API and MCP access that power our integrations. Try the TP53 example — and your own sequences — at app.genomicintelligence.ai.
These are computational predictions intended for research and development, not clinical or diagnostic decisions.