Splice site prediction on the DNA Analysis Platform
The splice-site task is live on the Genomic Intelligence platform — predict donor and acceptor sites straight from DNA sequence, walked through with the built-in HBB example.
The splice-site task is now available as an interactive web application on the Genomic Intelligence DNA analysis platform at app.genomicintelligence.ai. Give it a stretch of DNA and it predicts where the spliceosome cuts — the donor sites at the 5′ end of each intron and the acceptor sites at the 3′ end.
Why splice sites matter
Splicing is how a gene’s introns are removed and its exons are joined to make a mature transcript. Where those cuts fall determines which exons end up in the final message, and small sequence changes that shift or destroy a splice site are a well-known cause of disease. Predicting donor and acceptor sites directly from sequence is a core sequence-to-function problem. The signal is local and encoded in the DNA, the kind of pattern a genomic foundation model can learn to read.
What the model takes as input
The splice task takes a DNA sequence and returns the donor and acceptor sites
it finds along that sequence. On the platform you can supply the sequence in a few
ways: pick a gene from the built-in examples, search for a gene or a
chr:start-end coordinate range, paste raw nucleotides, or upload a FASTA file.
The prediction here runs on the G0 BigBird Splice Site Annotation model.
Running the HBB example
As a worked example we loaded the HBB (beta-globin) region —
chr11:5,225,464-5,229,395, a 3,932 bp window covering the gene’s three exons —
and ran the annotation.
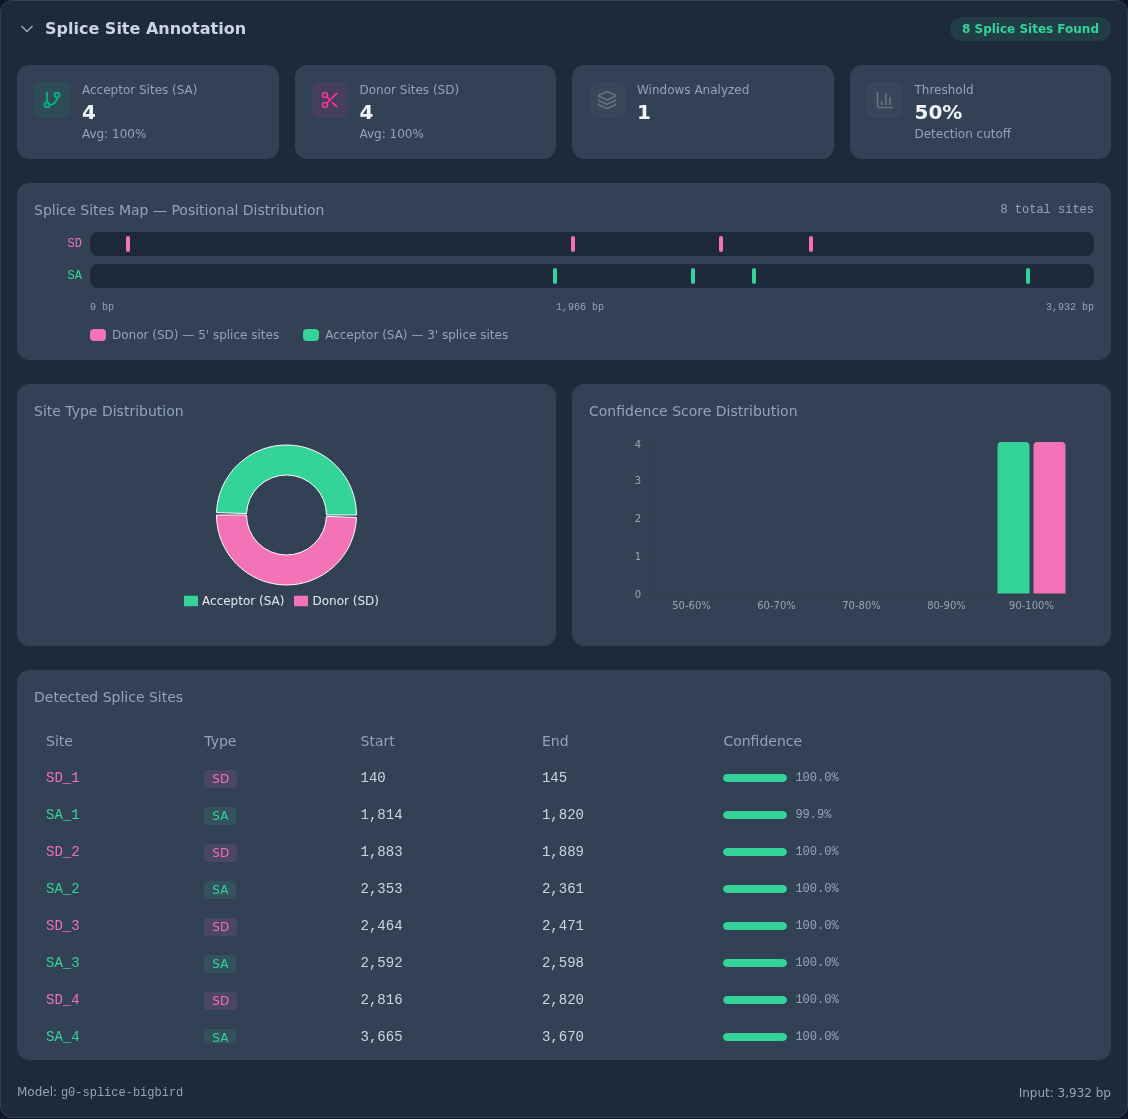
The dashboard reports 8 splice sites in this window: an even split of 4 donor
sites (SD) and 4 acceptor sites (SA), scored across a single analysis window
against the 50% detection threshold, with an average confidence of 100% on each
side. The positional map places each call along the 0–3,932 bp region, the donut
shows the balanced site-type split, and the confidence histogram puts every call
in the top 90–100% bucket. The Detected Splice Sites table lists every site
with its type, start, end, and confidence: SD_1 at 140–145, SA_1 at
1,814–1,820, SD_2 at 1,883–1,889, SA_2 at 2,353–2,361, SD_3 at 2,464–2,471,
SA_3 at 2,592–2,598, SD_4 at 2,816–2,820, and SA_4 at 3,665–3,670, every
one at 99.9–100% confidence. Each row is a coordinate-anchored prediction you can
line up against the known exon structure of the gene.
For research use
These are computational predictions intended for research and development, not clinical or diagnostic decisions. They are a fast way to scan a sequence for candidate splice sites and prioritize what to look at next, not a substitute for experimental validation.